The Usage tab is visible to Team Admins only.
Filtering and Exporting
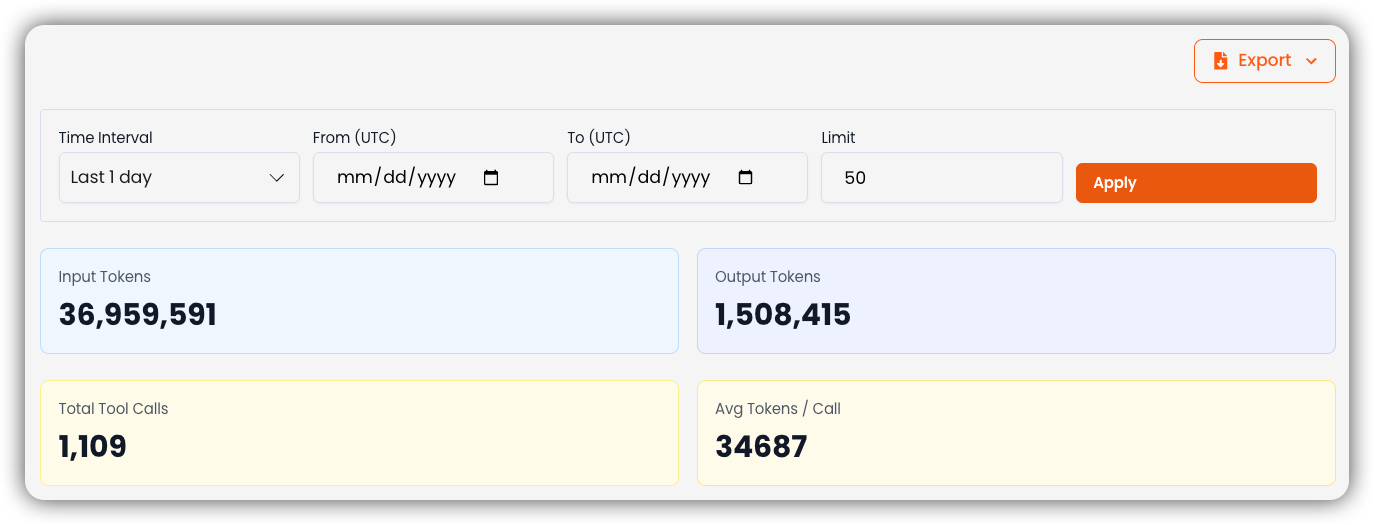
At the top of the dashboard, use the date range filter to scope the report to a specific period — options include preset ranges (e.g., last 7 days, last 30 days) or a custom date range. This lets you track how usage evolves over time and evaluate the impact of workflow changes or shifts in team activity. The Export button next to the filter lets you download the usage data for external reporting or deeper analysis.Overview Metrics
Below the filters, four summary cards cover the selected time period:- Total Input Tokens – The number of tokens sent to AI models by your team.
- Total Output Tokens – The number of tokens returned by AI models.
- Total Tool Calls – The total number of times AI tools were invoked.
- Avg. Tokens per Call – The average token consumption per tool call, useful for gauging efficiency.
Charts
The charts section visualizes token consumption across models and projects for the selected period.Tokens by Model (Pie Chart)
A proportional breakdown of token usage across AI models (e.g., GPT-4, Claude, Others). Use this to understand which models are driving the most consumption.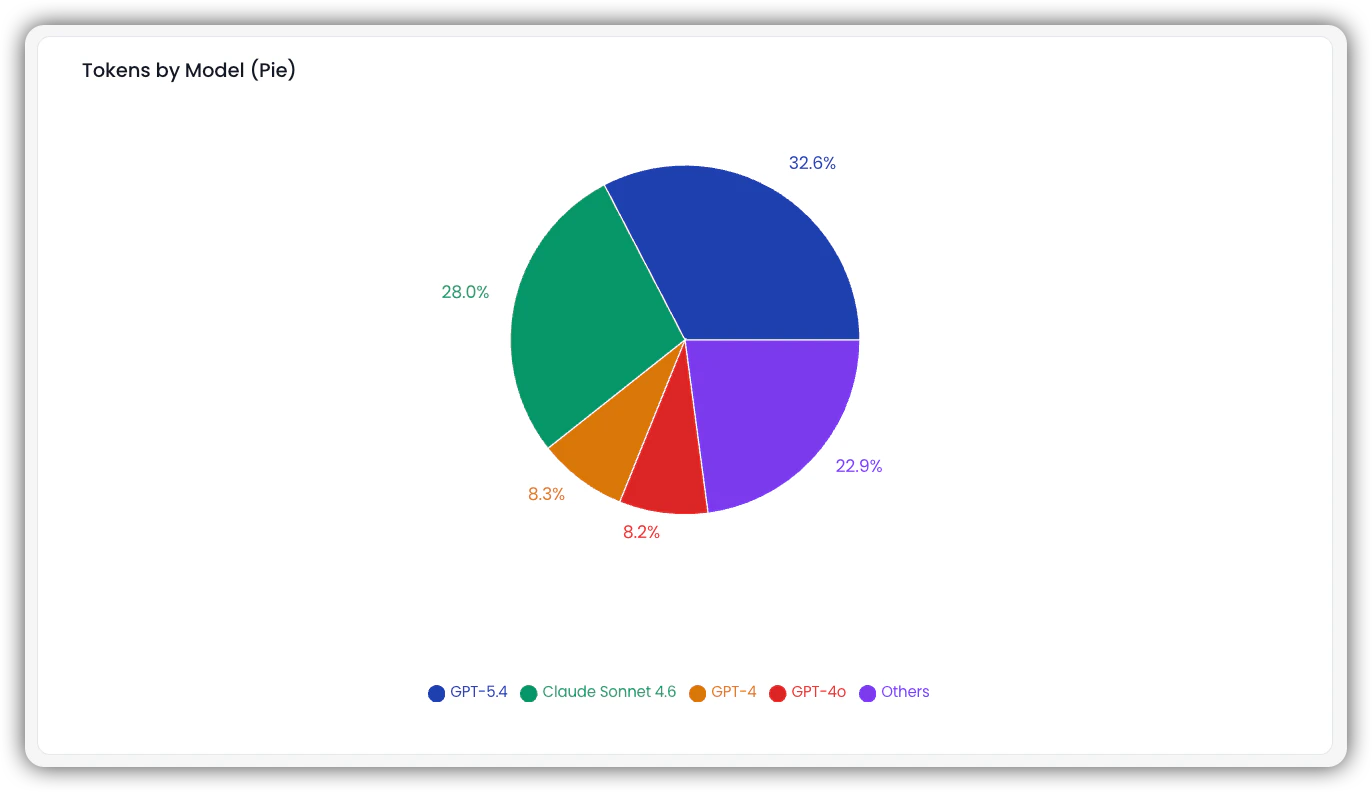
Top Projects by Input Tokens (Bar Chart)
A ranked view of projects by total input tokens consumed. Projects at the top are the most AI-intensive on the input side and may be candidates for prompt optimization.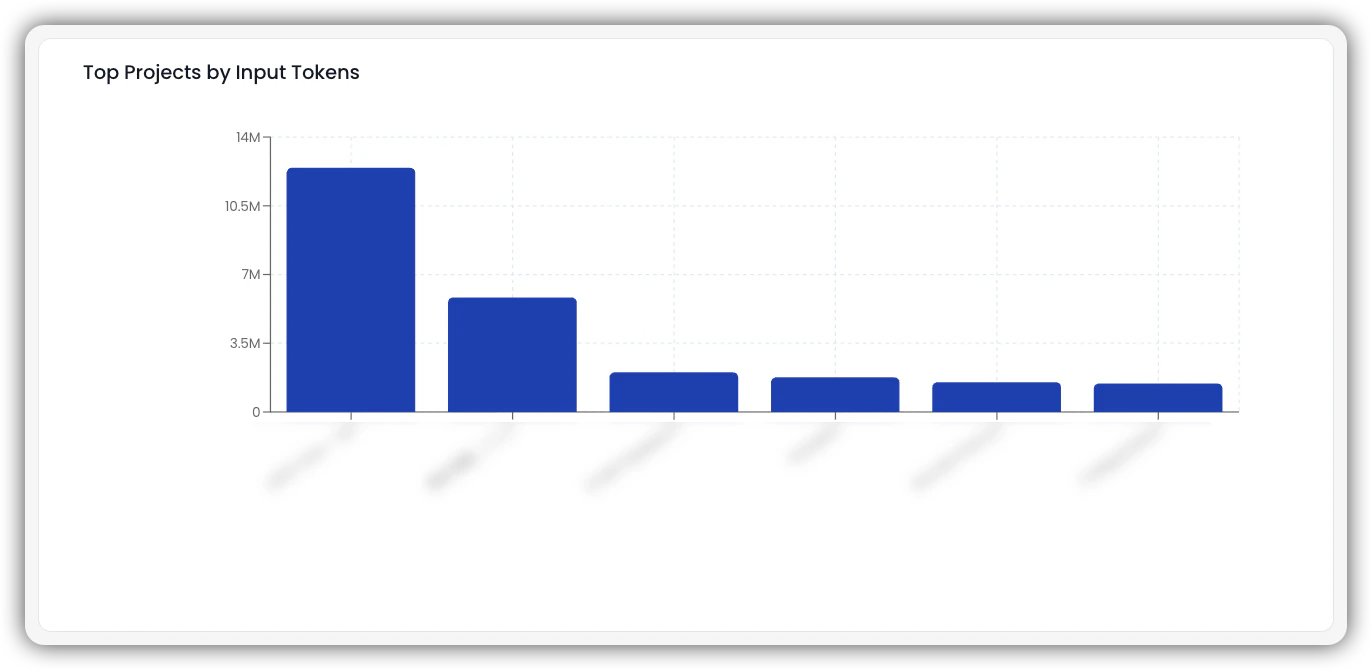
Top Projects by Output Tokens (Bar Chart)
A ranked view of projects by total output tokens generated. High output token counts can indicate verbose model responses or high-volume content generation workflows.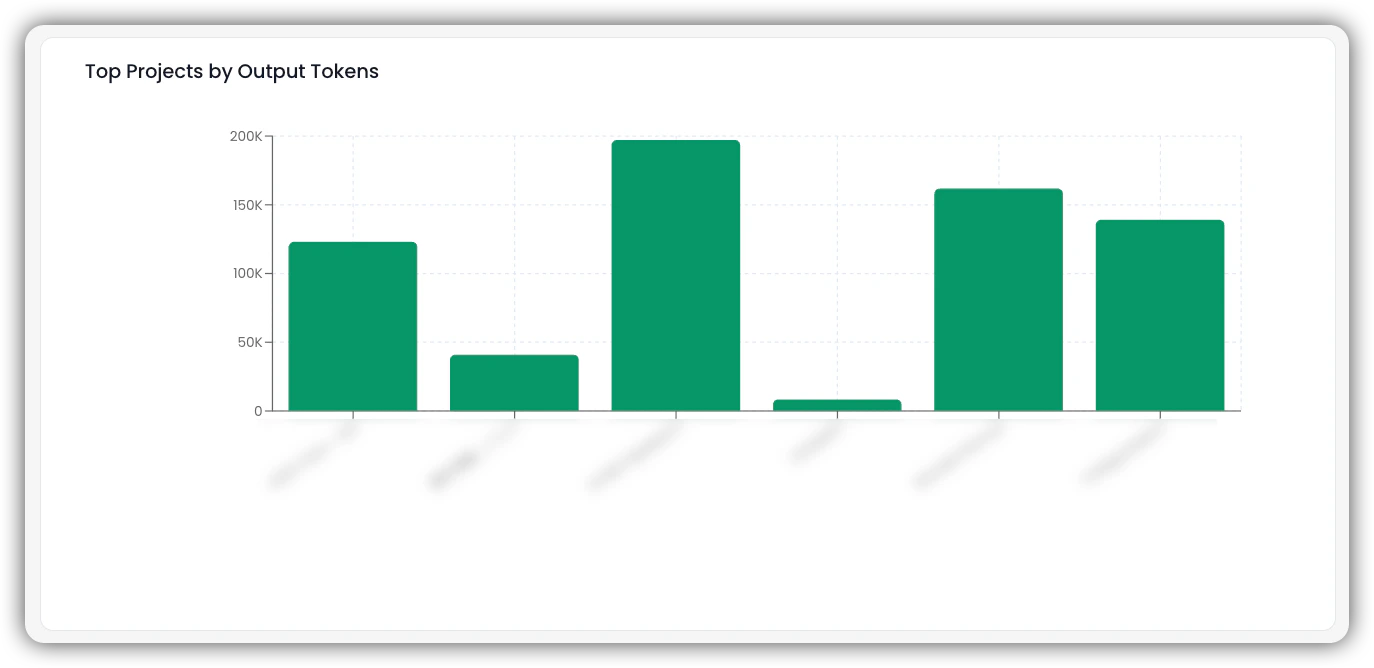
Tables
Input and Output Tokens by Project
Lists each project with its total input and output token counts. Use this to drill down into specific projects and understand their individual AI footprint.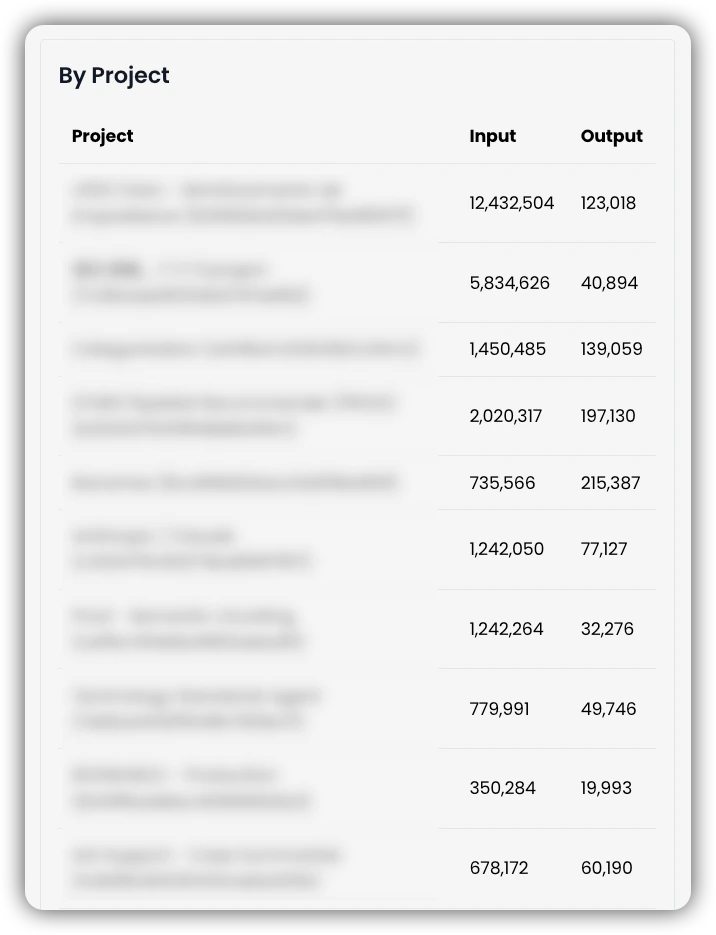
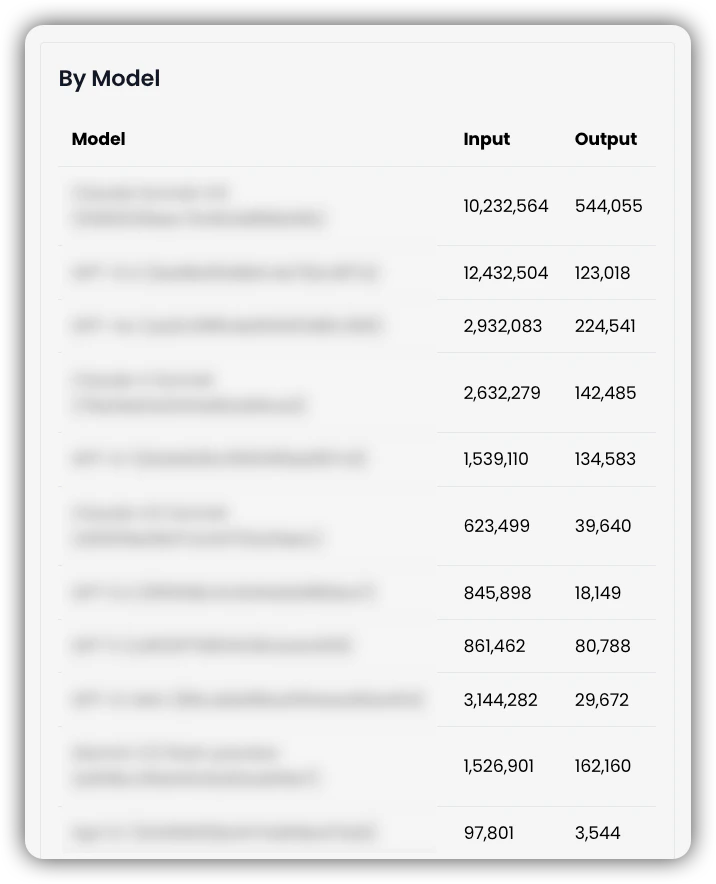
Input and Output Tokens by Model
Breaks down token consumption by AI model, showing input and output totals for each. Use this to evaluate model usage patterns and inform decisions around model selection or cost optimization.